|
Digital News Report – Stocks were higher on Friday and most markets in the United States and Europe were higher for the week (see charts below). All of the sectors gained Friday with the Industrial Goods sector gaining the most.
The DJIA index increased nearly 260 points to 12,153.68. The S&P 500 jumped 1.95 percent to 1,263 and the small-cap Russell 2000 gained 2.64 percent to 744.64.
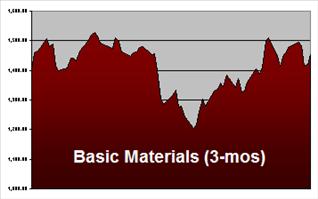
The Basic Materials sector gained 2.32 percent on Friday. Inside that sector the Major Integrated Oil & Gas Sector gained 1.63 percent.
Exxon Mobil Corporation Common (NYSE: XOM), a component in the Major Oil and Gas Sector, added $1.02 (+1.30%) to $79.72. The volume of trading was off by 40 percent.
The share price of Chevron Corporation (NYSE:CVX) gained $1.55 (+1.47%) to $107.05. The volume of trading in Chevron was also off by 40 percent. In the after-hours there was a bid of $106.82 on 400 shares and an ask of $107.00 on 300 shares.
The share price of Royal Dutch Shell PLC Royal Dut (NYSE: RDS-A) increased $1.18 (+1.70%) to $70.73 a share.
There are a couple factors that could potentially push oil prices higher. An improved economy could increase the demand for oil and push the price higher.
A United Nations report suggested that Iran was working to develop nuclear weapons. Some have speculated that Israel may strike the nuclear facilities while others have called for new sanctions on the Persian country.
Light sweet crude oil in the United States jumped $1.21 (+1.24%) to $98.99 and Brent crude oil was up $1.45 (+1.29%) to $114.16 a barrel.
By: Tim Edwards
| Company Name | Price | Change | Chg % | P/E ratio | Mkt Cap | Dividend yield |
| Exxon Mobil | 79.72 | 1.02 | 1.30% | 9.6 | 382.11B | 2.37 |
| Chevron | 107.05 | 1.55 | 1.47% | 7.93 | 213.19B | 3.01 |
| Royal Dutch Shell | 70.73 | 1.18 | 1.70% | 7.02 | 223.22B | 4.77 |
| Marathon Oil | 28.33 | 1 | 3.66% | 10.86 | 19.94B | 2.18 |
| BP plc (ADR) | 44.01 | 0.91 | 2.11% | 6.03 | 139.07B | 3.82 |
World Stock Indexes:
| 11/11/2011 | Digital News Report | 1 Day | 1 Day | 1 Week | 30-Day |
| 12,153.68 | DJIA (USA) | 259.82 | 2.18% | 1.42% | 14.06% |
| 1,263.85 | S&P 500 (USA) | 24.15 | 1.95% | 0.85% | 14.98% |
| 2,678.75 | Nasdaq (USA) | 53.60 | 2.04% | -0.28% | 14.68% |
| 744.64 | Russell 2000 (USA) | 19.16 | 2.64% | -0.25% | 22.17% |
| 6,057.03 | DAX (Germany) | 189.22 | 3.22% | 1.52% | 12.65% |
| 5,545.38 | FTSE 100 (England) | 100.56 | 1.85% | 0.33% | 9.26% |
| 3,149.38 | CAC 40 (France) | 84.54 | 2.76% | 0.83% | 7.60% |
| 2,480.35 | Shanghai (China) | 0.89 | 0.04% | -1.89% | 5.12% |
| 19,137.17 | Hang Seng (Hong Kong) | 173.28 | 0.91% | -3.56% | 13.76% |
| 8,514.47 | Nikkei 225 (Japan) | 13.67 | 0.16% | -3.26% | -0.36% |
Sector Chart:
| 11/11/2011 | Nine Sectors | One-Day | One-Week | 30-Day |
| 1,453.83 | Basic Materials Sector | 2.32% | -1.86% | 20.81% |
| 1,364.37 | Conglomerates Sector | 2.17% | 1.16% | 14.00% |
| 1,489.39 | Consumer Goods Sector | 2.22% | 3.12% | 16.68% |
| 1,294.86 | Financial Sector | 2.26% | 0.12% | 16.40% |
| 1,395.35 | Healthcare Sector | 1.80% | 0.75% | 11.77% |
| 1,434.98 | Industrial Goods Sector | 2.67% | -0.03% | 23.29% |
| 1,592.59 | Services Sector | 2.45% | 0.12% | 18.34% |
| 1,387.13 | Technology Sector | 2.17% | -0.62% | 14.69% |
| 1,201.55 | Utilities Sector | 1.61% | 0.70% | 9.00% |

